- Measuring Growth
- Reports
- Accountability Reports
- School Reports
- District Reports
- Teacher Reports
- Comparison Reports
- Human Capital Retention Dashboard
- Roster Verification (RV)
- Getting Started
- Specifying Instructional Responsibility
- All Actions by Role
- All Actions for Teachers
- All Actions for School Administrators or Roster Approvers
- Manage teachers' access to RV
- Assign other school users the Roster Approver permission
- View a teacher's rosters
- Take control of a teacher's rosters
- Add and remove rosters for a teacher
- Copy a roster
- Apply a percentage of instructional time to every student on a roster
- Batch print overclaimed and underclaimed students
- Remove students from a roster
- Add a student to a roster
- Return a teacher's rosters to the teacher
- Approve a teacher's rosters
- Submit your school's rosters to the district
- All Actions for district admin or district roster approvers
- Assign other district users the Roster Approver permission
- Take control of a school's rosters
- View a teacher's rosters
- View the history of a teacher's rosters
- Edit a teacher's rosters
- Add and remove rosters for a teacher
- Copy a roster
- Apply a percentage of instructional time to every student on a roster
- Batch print overclaimed and underclaimed students
- Return a school's rosters to the school
- Approve rosters that you have verified
- Submit your district's rosters
- Understanding the RV Pages
- Viewing the History of Actions on Rosters
- Additional Resources
- Admin Help
- General Help
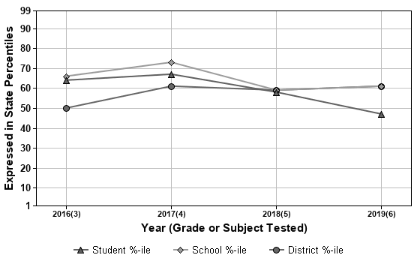 |
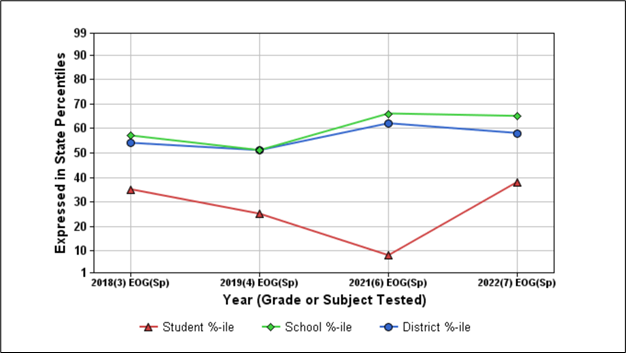
The displays the student's performance on prior assessments. Viewing a student's testing history across subjects can be helpful for teachers. However, it's important not to place too much emphasis on comparing individual scores from one year to the next. The data presented here represents snapshots of the student's academic performance each year and should not be interpreted as a student's growth trend.
To view the report for a different test or subject, choose from the list under the Tests/Subjects tab in the blue menu bar.
Understanding the Graph
The data in the chart is expressed in state percentiles.
The data points marked with a red triangle represent the student's scores on previous assessments in the selected subject.
The data points marked with a green diamond represent the average score for the school in which the student tested each year.
The data points marked with a blue circle represent the average score for the district in which the student tested each year. If the school and district averages are the same, the district's data points will be under the school's data points and will not be visible.
Put the pointer over any data point to see the school and district in which the student took the test.
Understanding the Table
The top row of the table lists the student's scores on prior assessments in this subject. Scores for assessments analyzed with the gain model are expressed as state NCEs. For all other assessments, scale scores are displayed.
The second row displays the state percentile for each of the student's scores.
The next row displays the student's state performance level for each state assessment.
The bottom row displays either the lexile or quantile for each assessment, depending on the subject.