- Measuring Growth
- Public Reports
- Restricted Reports
- Roster Verification (RV)
- Getting Started
- Specifying Instructional Responsibility
- All Actions by Role
- All Actions for Teachers
- All Actions for School Administrators or Roster Approvers
- Manage teachers' access to RV
- Assign other school users the Roster Approver permission
- View a teacher's rosters
- Take control of a teacher's rosters
- Add and remove rosters for a teacher
- Copy a roster
- Apply a percentage of instructional time to every student on a roster
- Batch print overclaimed and underclaimed students
- Remove students from a roster
- Add a student to a roster
- Return a teacher's rosters to the teacher
- Approve a teacher's rosters
- Submit your school's rosters to the district
- All Actions for district admin or district roster approvers
- Assign other district users the Roster Approver permission
- Take control of a school's rosters
- View a teacher's rosters
- View the history of a teacher's rosters
- Edit a teacher's rosters
- Add and remove rosters for a teacher
- Copy a roster
- Apply a percentage of instructional time to every student on a roster
- Batch print overclaimed and underclaimed students
- Return a school's rosters to the school
- Approve rosters that you have verified
- Submit your district's rosters
- Understanding the RV Pages
- Viewing the History of Actions on Rosters
- Additional Resources
- General Help
Reporting FAQs
What is the difference between growth and proficiency?
Proficiency is captured by a test score at a single point in time. Growth is the change in achievement over two or more time points, and EVAAS determines growth by comparing student assessment scores.
Is it more difficult for high-achieving students to show growth?
Educators serving high-achieving students are often concerned that their students' entering achievement level makes it more difficult for them to show growth. However, with EVAAS, educators are neither advantaged nor disadvantaged by the type of students they serve. The modeling reflects the philosophy that all students deserve to make appropriate academic progress each year. EVAAS reporting provides reliable and valid measures of growth for students regardless of their achievement level.
The value-added models are designed to estimate whether groups of students served by a district, school, or teacher made appropriate growth compared to Expected Growth.
For assessments analyzed with the gain model, expected growth represents the amount of progress required for a group of students to maintain its achievement relative to the state distribution. A group of exceptionally high-achieving students could meet expected growth simply by remaining exceptionally high achieving relative to their peers in the same grade and subject or course statewide from one year to the next.
For assessments analyzed with the predictive model, the model determines the relationships between all students' prior assessment scores and their exiting achievement on the selected assessment. By considering how all other students performed on the assessment in relation to their testing histories, the model calculates an expected score for each student based on their individual testing history. Meeting expected growth indicates that, on average, the group of students made the expected academic progress compared to other students in the state.
As long as the assessments that are administered are able to measure differences in achievement among very high-achieving students, then it is possible to measure the growth of those students reliably using EVAAS. All assessments used in the value-added analyses have sufficient stretch at both the very low and very high ends of the achievement range to be used this way.
As a result, EVAAS is fair not only to districts, schools, or teachers serving high-achieving students but it is also fair to the students themselves. The modeling that underlies EVAAS considers the progress of all students regardless of their entering achievement, and the reporting shows whether the curriculum and instruction appropriately target these students' academic needs. High-achieving students might require enrichment work in the same way that low-achieving students might need remediation to make sufficient progress.
Why can't I use Diagnostic reports and projections to calculate my Value-Added report?
The Value-Added reports, Diagnostic reports, and Student Projections use different analytic models and serve different purposes in supporting educators' insight about student learning. As a result, Diagnostic and Projection reports might not align with Value-Added reports.
The three most common reasons why a teacher's Value-Added and Diagnostic reports might look different are:
- The analysis that generates the Teacher Value-Added reports accounts for the teacher's instructional responsibility for each student. In contrast, in the Teacher Diagnostic report, all students are weighted equally. As a result, the growth measures for each achievement group in the Diagnostic report reflect the influence of all teachers who had instructional responsibility for the selected grade and subject area for the students in the group.
- The Value-Added model is a conservative estimate of growth for a teacher's group of students. The analyses that generate the Value-Added reports rely on sophisticated, robust analytic models to yield the most reliable measures possible. The growth measures reported in the Diagnostic reports are generated from simpler calculations. Although the information in the Diagnostic reports is useful for reflecting on the instructional practice, it should not be used for assessing a teacher's impact on student achievement.
- For tests analyzed with Expected Growth methodology (gain model), all students are included in the analyses that generate the Value-Added report. To be included in the Diagnostic report, a student must have both the current and previous year's scores in the selected subject. You'll find a list of students not in the Diagnostic report on the right side of the report.
The projections indicate how a student is likely to score if the student makes the amount of growth that was typical for students who took the assessment in the most recent year. While the projection is a reliable measure of a student's entering achievement level, it is not accurate to compare the projection to the student's exiting score on the assessment to determine whether there was growth. This type of simple comparison does not account for measurement error, so it does not yield a reliable measure of the student's growth.
What is the difference between expected scores and projections?
For assessments analyzed with the predictive model, each student's expected score is created as part of the value-added analysis. Entering achievement reflects students' achievement before the current school year or when they entered a grade and subject or course. The model determines the relationships between all students' prior assessment scores. By considering how all other students performed on the assessment in relation to their testing histories, the model calculates an expected score for each student based on their individual testing history.
Because the expected score is based on the performance of other students statewide who took the assessment in the same year, it's not possible to generate the expected score prior to the assessment.
Student projections use a similar modeling approach for students' expected scores. In both models, the relationships are defined by the most recent cohort of test takers, and in both models, the student projection or expected score is based on the student's own testing history and these defined relationships. However, there is one key difference in that the relationships for student expected scores are based on students in the same cohort who have not yet taken the assessment, while student projections are based on students who are in the previous year's cohort and have taken the assessment during the most recent prior year available. For example, the projections to Math 1 look at the growth of students who took the Math 1 assessment in the prior year. This information is used to project how students who have not yet taken the Math 1 assessment will perform based on each student's individual testing history. As with the predictive model, the projection model assumes that students will make the average amount of growth observed in the state.
Based on their own testing history, the projection indicates how a student is likely to score if the student makes the amount of growth that was typical for students who took the assessment in the most recent year. While the projection is a reliable measure of a student's entering achievement, it is inappropriate to compare the projection to the student's exiting score on the assessment to determine whether there was growth. This type of simple comparison does not account for measurement error, so it does not yield a reliable measure of the student's growth.
What is the difference between the growth measure and the growth index?
The growth measure represents the combined growth of all students used in the analysis. However, the growth measure is an estimate and must be reported with its associated standard error. The standard error is a measure of certainty associated with the growth measure and enables us to establish a confidence interval around the growth measure. The level of certainty is related to how strong the evidence is that the teacher's students met, exceeded, or fell short of Expected Growth. The strength of the evidence varies depending on how many students were included in the analysis, how complete the students' testing records were, and for students who have incomplete testing records, which scores are missing. When more students are included in analyses, the evidence of student growth, or lack of growth, is often stronger simply because more data was used to generate the growth measure.
Some schools have many students with multiple classrooms per grade; some schools do not. When more students are included in the analyses, the evidence of student growth, or lack of growth, is often stronger because more data was used to generate the growth measure. For Teacher reports, the standard error also accounts for whether the teacher had full or partial responsibility for the student's instruction as indicated during roster verification.
The index takes this level of evidence into account. It's calculated by dividing the growth measure by its standard error. This process ensures that all indexes are on the same scale, regardless of which test was administered or what scaling units are used in the reporting. Using the standard error to produce an index considers the fact that when we have more data, we can be more confident about the growth measure.
Because the index reflects both the amount of student Growth and the strength of the evidence, it's important to rely on the index more than the growth measure.
Why doesn't EVAAS report a growth measure for each student?
While a student's score on any given assessment is a measure of what the student knows on test day, human factors and other outside influences could cause an individual student's score to differ from the student's actual achievement. For any student, the difference between their past achievement and the student's most recent test score might not reflect the student's growth in the subject with complete precision. On test day, the student might have guessed, misread a question, or otherwise answered a question in a way that did not reflect their exact achievement in the subject. The impact of this measurement error can cause growth measures for an individual student to be imprecise and unreliable.
For that reason, EVAAS only provides growth measures for groups of students. Because more data is included in these measures, the impact of measurement error associated with each individual test score is minimized. When several students take a course from the same teacher or in the same school, EVAAS compares the entering achievement level of the group to the group's achievement at the end of the course. Conceptually, the difference between those two points for the whole group determines the growth measure. In practice, EVAAS uses many years, grades, and subjects in the analyses, and because so much data is included, the academic growth of the group can be measured with much greater precision and reliability than the growth of a single student.
What is the difference between a student not used in the report and a student not used in the analyses?
For assessments analyzed with the gain model, students are placed into achievement groups based on the average of their two most recent scores in the selected subject for reporting on the Diagnostic report. For example, in a Diagnostic report for sixth-grade math, students are placed into achievement groups based on the average of their fifth-grade and sixth-grade math scores. If a student's fifth-grade math score is missing, that student is not placed into an achievement group on this report. For K-2 assessments in grades 1 and 2, students are placed into achievement groups based on the average of their spring and fall scores. For kindergarten, this placement is based on the average of students' spring and winter scores.
For assessments analyzed with the predictive model, students are placed into achievement groups based on where their expected score falls in the state distribution for that grade and subject or course for reporting on the Diagnostic report. Students who lack sufficient data will not have an expected score and therefore will not be included in an achievement group on this report. For all of these tests, a student must have three prior assessment scores across grades and subjects to have an expected score.
Students Not Used in Analysis are not included in the Diagnostic report and not used in the value-added analysis. Students Not Used in Report are not included in the Diagnostic report but are used in the value-added analysis.
What are Normal Curve Equivalents? Are they the same thing as percentiles?
Normal Curve Equivalents (NCEs) provide a common scale when comparing different tests and test versions. In essence, test scale scores are translated to exiting NCEs, which enable comparison of the achievement levels of groups of students from year to year. An NCE of 50 is the in the state average attainment level of students within a grade/subject/year.
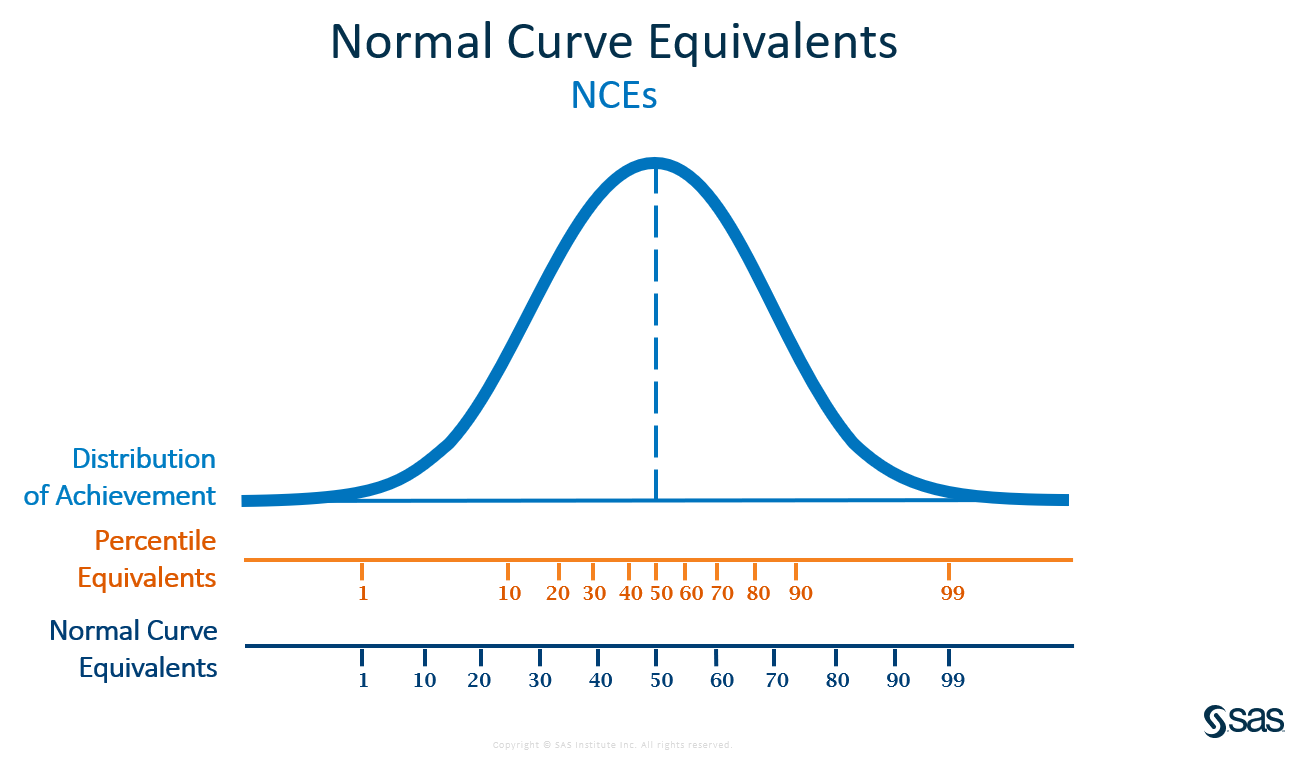
NCEs and percentiles are not the same thing however. A student might score at the 80th percentile for an end-of-grade assessment, but their score represents an NCE of 67.
Percentiles are frequency based. In other words, they are determined by how many students scored at each point in the distribution. As a result, they are not evenly spaced. In a typical normal distribution, the percentiles are very close together in the middle and farther apart at the tails. Why? Because many students score about average while few students earn the lowest or highest score on the assessment.
In contrast, NCEs are equal interval. The distance between the 10th and 20th NCEs is the same as the distance between the 50th and 60th. As a result, NCEs can be averaged, and it is possible to measure the progress of groups of students as they move in the distribution.
Converting scores to NCEs also helps ensure value-added reporting can still be provided when assessments change. When NCEs are used, the analysis measures changes in achievement in NCEs rather than scale scores. The students in a school simply need to maintain their achievement level relative to the state distribution to meet Expected Growth.
Why is the multi-year trend for student growth measures not the same as an individual subject?
The multi-year trend of the student growth measure is a simple average of three individual years, unlike multi-year trends on other value-added reports. The student growth measure reports an index value and level, which are based on the teacher's applicable data from EOG, EOC, K-2 assessment, and CTE state assessments within each year.
The multi-year trend for an individual subject includes up to three years of single-year growth measures, which are weighted by the number of student scores in the individual subjects and grades of the educator's value-added reports. The multi-year trend growth measure is a weighted average of the single-year growth measures, and the multi-year trend standard error reflects having more evidence about the overall average. As a result, the multi-year trend index is not a simple average of the single-year index values, unlike the multi-year trend of the student growth measure.
The key difference is that the student growth measure is a simple average whereas the individual multi-year trend combines all the measures and calculates a new standard error to determine the overall index.
What is partial enrollment? Are partially-enrolled students used in the analysis?
NCDPI has produced a thorough explanation of partial enrollment. If a student doesn't meet partial enrollment, the scores will not be used in the current or future analysis. For example, if a student did not meet partial enrollment in grade 4, then these scores would not be used as predictors for grade 5 Science analysis.
Why does a teacher not have a report for a particular subject?
Gain Model
The teacher value-added model includes teachers who are linked through the roster verification process to at least six students with a valid test score in the same subject and grade for assessments analyzed with the gain model. To receive a Teacher Value-Added report for a particular year, subject, and grade, there are two requirements.
First, a teacher must claim at least six Full Time Equivalent (FTE) students with usable test scores in a specific subject, grade, and year. The teacher's number of FTE students is based on the number of students linked to that teacher and the percentage of instructional responsibility the teacher claims for each student. For example, if a teacher taught 10 students at 50% instructional responsibility, the number of FTE students would be five, and the teacher would not receive a Value-Added report. If another teacher taught 12 students at 50% instructional responsibility, that teacher would have six FTE students and would receive a Value-Added report. The instructional responsibility attribution is obtained from the student-teacher linkage data.
Second, the teacher must be linked to at least five students with prior test score data in the same subject, and the test data might come from any prior grade as long as it is part of the student's regular cohort. (If a student repeats a grade, then the prior test data would not apply as the student has started a new cohort.) One of these five students must have a "simple gain," meaning the same subject prior test score must come from the most recent prior year and grade available. Students are linked to a teacher based on the subject area taught and the assessment taken.
Predictive Model
There must be 10 students meeting criteria for inclusion in that year, subject, and grade that have the required three prior test scores needed to obtain an expected score in that year, subject, and grade for assessments analyzed with the predictive model. Again, in order to receive a Teacher Value-Added report for a particular year, subject, and grade, a teacher must have at least six FTE students in a specific subject, grade, and year.
I am the only teacher in my school. Why doesn't my report match the School report?
The School and Teacher Value-Added reports are generated from two separate analyses. While both use similar analytic models, the percentage of instructional responsibility used in the analysis might differ between the School and Teacher Value-Added reports. In the school analysis, students included count 100%. In the teacher analysis, students are weighted based on the percentage of instructional responsibility claimed in roster verification. For the predictive model, School and Teacher reports can also differ because the distribution of teachers is different from the distribution of schools. Each teacher is compared to other teachers in the same grade or subject, and each school is compared to other schools in the model.
For more information about your specific situation, click the Contact Us link in the top right corner of the screen to submit a ticket to the technical support team.
Why was a student excluded from my Teacher report?
Gain Model
All students' scores are included in the analysis if the scores do not meet any criteria for exclusion outlined in the Statistical Models and Business Rules document. In other words, a complete history of every student's Math and Reading results for the student's cohort are incorporated into the models. There are some exclusion rules based on policy decisions by NCDPI. For example, student scores are excluded from the analysis if the student is flagged as a first year EL student or if the student does not meet partial enrollment. Additionally, a student score could be excluded if it is considered an "outlier" in context with all other prior scores from that student. More details are provided in the Statistical Models and Business Rules document.
Predictive Model
In order for a student's score to be used in the analysis for a particular subject, grade, and year, the student must have at least three valid predictor scores that can be used in the analysis, none of which are deemed outliers. These scores can be from any year, subject, and grade used in the analysis and may include subjects other than the subject being predicted. It is important to note not all students have to have the same three prior test scores. They only have to have some subset of three that were used in the analysis. There are some exclusion rules based on policy decisions by NCDPI. Student scores are excluded from the analysis if the student is flagged as a first year English Learner (EL) student or if the student does not meet partial enrollment to be included in the analysis for EOC, and CTE assessments. There are no partial enrollment rules used to include or exclude students in the SAT, PSAT, and ACT analyses. Additionally, a student score could be excluded if it is considered an "outlier" in context with all of other prior scores from that student.
What predictors are used to generate the Value-Added reports and Student Projections?
In most cases, EVAAS will attempt to use a student's entire testing history in the analysis. For the predictive model, there are predictors for each subject that are used to determine the expected score for that student.
Which assessments does EVAAS use?
The North Carolina Department of Public Instruction provides results for state administered assessments to EVAAS for use in value-added analyses. EVAAS uses data from these assessments to generate value-added reports for districts, schools, or teachers. For more information, see the Technical Details section of the Help.
Gain Model
EVAAS uses this approach to generate growth measures for these assessments:
- K-2 assessments
- EOG reading in grades 3 through 7
- EOG math in grades 4 through 7
- EOG reading and math in grade 8 before 2022-23
Predictive Model
This model is used to provide reports for these assessments:
- EOG science in grades 5 and 8
- EOG reading and math in grade 8 starting in 2022-23
- EOC Math 1, Math 3, Biology, and English II
- CTE post-assessments
- ACT, PSAT, and SAT
How do I update my email address?
Accounts are managed locally. If the email address on your account is incorrect, there are two steps to fix this and prevent future changes.
Step One: Contact your school or district data manager. Without a correction to the email address associated with your district's authoritative source, the email address tied to your EVAAS account will be overwritten during the next round of account maintenance. For additional assistance, contact NCDPI.
Step Two: Forward these steps to your school EVAAS admin to update it immediately in the EVAAS system.
To update a user's email address:
- Log in to your admin account.
- Click Admin, which is located above the blue navigation bar.
- Select the person's account.
- In the window that pops up, select Change Email.
- You will be prompted to enter the user's email address twice.
- Follow the remaining prompts.
How do I access my report if I changed districts or am no longer teaching?
Your Value-Added report is part of your personnel record and will remain under your previous district. Contact the Human Resource department of your previous district to obtain hard copies of your past Teacher reports. District personnel who require assistance in retrieving historical EVAAS data should contact NCDPI.
Admins: Who can see which reports? Why can't I see Teacher reports?
School Teacher Summary permission allows a user to view Teacher Value-Added reports for all teachers at that specific school. If your account should have this access, contact your school EVAAS admin to request this permission.
Admins: Why can't I see Teacher reports for some of my teachers?
The most common reason is that the teacher did not meet the minimum number of students required and therefore did not receive a report. However, there are reasons for a teacher to have a report and not be available under your School Teacher Summary. A teacher new to your building will not appear under your School Teacher Summary. If the teacher was at a different school the previous year, the Teacher report would appear at the previous school only. If a teacher was at multiple schools during the previous year, the school in which the teacher claimed the greatest teaching responsibility in roster verification would determine the location of the report.
Using the Predictive Model for Certain Assessments
Given the available testing, current state policies, and the prevalence of Math 1 in grade 8, NCDPI has decided to move from the gain to the predictive model for EOG Math and Reading in grade 8.
A key feature of the gain model is that it estimates growth for the population of students served, not just those who took the test. The model accommodates students with missing data and uses all available testing data for EOG math and reading in grades 3-8 over time to provide better estimates of student growth.
However, for some districts and schools, a significant portion of students have "missing" test scores for EOG Math 8 because they took EOC Math 1 in grade 8. The model is designed to account for students' missing test scores, and when students have EOG Reading 8 scores at the district or school, the model assumes that their EOG Math 8 scores are missing. In other words, the performance of these students over time and in EOG Reading Grade 8 currently influences the estimates of student growth for EOG Math 8 at a district or school. In prior years when students tested in both EOC Math 1 and EOG Math 8, this was less of a concern; however, the last cohort of these students has finally aged out of the gain model, which makes the missing scores have more of an impact.
Starting with the 2022-23 reporting, EOG Math and Reading in grade 8 will use the predictive model. This update prevents students who tested in EOG Reading 8 and Math 1 from influencing the EOG Math 8 growth measures at a district or school.