- Measuring Growth
- Public Reports
- Restricted Reports
- Accountability Reports
- School Reports
- District Reports
- Teacher Reports
- Student Reports
- Comparison Reports
- Roster Verification (RV)
- Getting Started
- Specifying Instructional Responsibility
- All Actions by Role
- All Actions for Teachers
- All Actions for School Administrators or Roster Approvers
- Manage teachers' access to RV
- Assign other school users the Roster Approver permission
- View a teacher's rosters
- Take control of a teacher's rosters
- Add and remove rosters for a teacher
- Copy a roster
- Apply a percentage of instructional time to every student on a roster
- Batch print overclaimed and underclaimed students
- Remove students from a roster
- Add a student to a roster
- Return a teacher's rosters to the teacher
- Approve a teacher's rosters
- Submit your school's rosters to the district
- All Actions for district admin or district roster approvers
- Assign other district users the Roster Approver permission
- Take control of a school's rosters
- View a teacher's rosters
- View the history of a teacher's rosters
- Edit a teacher's rosters
- Add and remove rosters for a teacher
- Copy a roster
- Apply a percentage of instructional time to every student on a roster
- Batch print overclaimed and underclaimed students
- Return a school's rosters to the school
- Approve rosters that you have verified
- Submit your district's rosters
- Understanding the RV Pages
- Viewing the History of Actions on Rosters
- Additional Resources
- General Help
School Accountability Growth Report
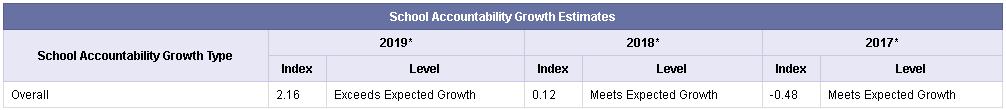
School Accountability Growth reports display overall growth index values that indicate whether the school's students, on average, exceeded, met, or did not meet Expected Growth across tested grades and subjects. The report displays single-year index values for up to three years.
A table at the bottom of the report lists the assessments included in the index values for the selected school.
Index values are based on both the value-added growth measures and their standard errors. Specifically, the index for a grade and subject or course is growth measure divided by its standard error. The index values reported here are based on growth data across grades and subjects. Because the index values are all on the same scale, regardless of which tests are included, they provide a fair and equitable way to compare growth across years and across schools.
Growth Indicators are displayed next to each index. The levels are determined using the following rules.
| Growth Indicator | Growth Index Value | Interpretation |
|---|---|---|
Exceeds Expected Growth | 2.00 or higher | Significant evidence that the school's students made more progress than expected growth. |
Meets Expected Growth | Between -2.00 and 2.00 | Evidence that the school's students met expected growth. |
Does Not Meet Expected Growth | Less than -2.00 | Significant evidence that the school's students made less progress than expected growth. |