- Measuring Growth
- Public Reports
- Restricted Reports
- Accountability Reports
- School Reports
- District Reports
- Teacher Reports
- Student Reports
- Comparison Reports
- Roster Verification (RV)
- Getting Started
- Specifying Instructional Responsibility
- All Actions by Role
- All Actions for Teachers
- All Actions for School Administrators or Roster Approvers
- Manage teachers' access to RV
- Assign other school users the Roster Approver permission
- View a teacher's rosters
- Take control of a teacher's rosters
- Add and remove rosters for a teacher
- Copy a roster
- Apply a percentage of instructional time to every student on a roster
- Batch print overclaimed and underclaimed students
- Remove students from a roster
- Add a student to a roster
- Return a teacher's rosters to the teacher
- Approve a teacher's rosters
- Submit your school's rosters to the district
- All Actions for district admin or district roster approvers
- Assign other district users the Roster Approver permission
- Take control of a school's rosters
- View a teacher's rosters
- View the history of a teacher's rosters
- Edit a teacher's rosters
- Add and remove rosters for a teacher
- Copy a roster
- Apply a percentage of instructional time to every student on a roster
- Batch print overclaimed and underclaimed students
- Return a school's rosters to the school
- Approve rosters that you have verified
- Submit your district's rosters
- Understanding the RV Pages
- Viewing the History of Actions on Rosters
- Additional Resources
- General Help
Teacher Value-Added
Student Growth Measure
The Student Growth Measure combines each teacher's growth index values from all tests and subjects in the most recent year to report an index and level (Exceeds Expected Growth, Meets Expected Growth, or Does Not Meet Expected Growth).
The Student Growth Measure includes all growth index values from K-2 Assessments, EOG, EOC, and CTE Post-Assessments in the most recent year.
These reports display an index value and level but do not display a growth measure. Because the growth measures for each grade and subject or course are on different scales, it's not possible to provide a meaningful composite growth measure. However, growth index values across all grades, subjects, and courses are on the same scale, so they can be combined in an appropriate and meaningful way. As a result, you will see a single index value for the composite.
The multi-year trend of the student growth measure is a simple average of three individual years, unlike multi-year trends on other value-added reports.
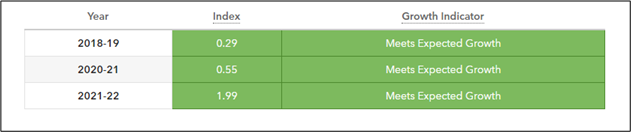
Understanding the Report
The table shows the teacher's index and Growth indicator. Teachers have a Student Growth Measure report even if they only have reporting for a single subject.
All subjects that contribute to the index are weighted by the number of students used in the Student Growth Measure report. However, the index is not simply the average of the index values for the individual subjects. This is because a new standard error is calculated, taking all the information from the included grades and subjects into account. This standard error is likely to be smaller for composites than for the individual grades and subjects because more data is used in the calculation. As a result, teacher composite index values might differ from the simple average of growth index values for individual grades and subjects.
Growth Indicators
The growth indicators applied to index values indicate how strong the evidence of growth is for the students served. When more data is available, there is more evidence to determine whether the group of students exceeded, met, or fell short of expected growth. The growth indicator of the composite might differ from the growth indicators for single subjects and grades or courses because there is more evidence when all the data is combined for the composite. With data from multiple grades and subjects, there is more evidence than for any single subject, grade, or course alone.
The growth indicators are color-coded using the same rules that are used in the value-added reports for single subjects.
| Color | Growth Index Compared to Expected Growth | Interpretation |
|---|---|---|
| Exceeds Expected Growth | At least 2 standard errors above | Significant evidence that the teacher's students made more progress than expected growth |
| Meets Expected Growth | Between 1 standard error above and 1 standard error below | Evidence that the teacher's students made progress similar to expected growth |
| Does Not Meet Expected Growth | More than 2 standard errors below | Significant evidence that the teacher's students made less progress than expected growth |
District Average
The option to display District Average is available when there is sufficient data. The District Average appears as a vertical purple line. This value represents the average of all teacher index values in the district for the selected grade and subject or course.
Distribution of Teachers
The table on the right displays the number of teachers statewide whose student growth measure falls within each Growth indicator. The distribution includes all teachers in the district who have a Student Growth Measure, regardless of the tests, subjects, or courses included in the composite.